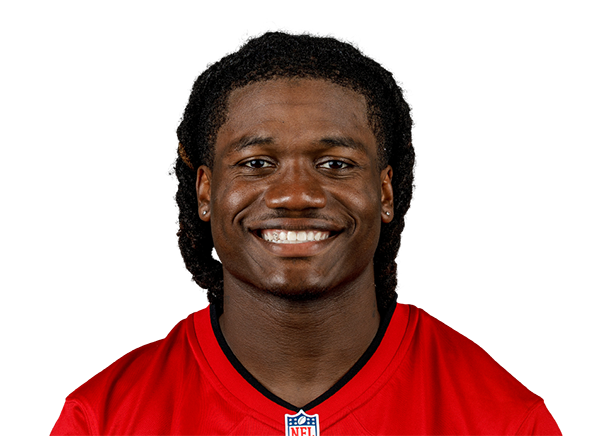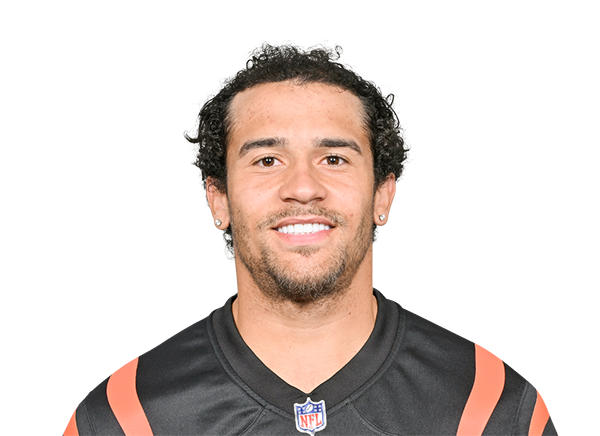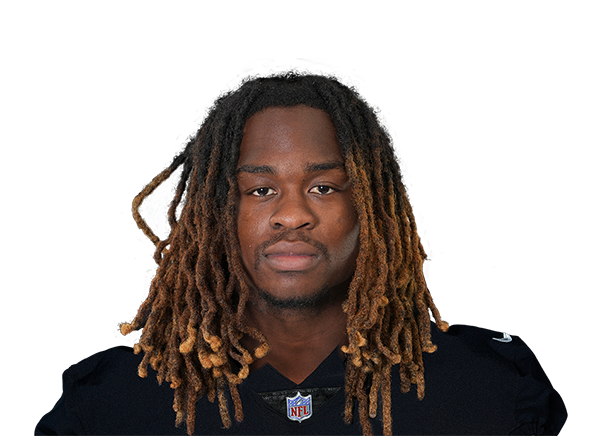
WEEK 1515.7 FPvs DEN · #10
WEEK 1617.9 FPvs TEN · #18
WEEK 1717.2 FPat ARI · #20
+1.7 FP/game vs. the pre-playoff outlook (15.2). Build an offer ↗

2026 · Weeks 15–17 · PPR
Find players whose playoff projection improves on their own pre-playoff outlook, then test an offer in Trade Analyzer.
Opponent matchup #1 allows the most fantasy points to the position. ESPN roster rates reflect prevalence across leagues. Check availability in yours.
+1.7 FP/game vs. the pre-playoff outlook (15.2). Build an offer ↗
+1.7 FP/game vs. the pre-playoff outlook (17.1). Build an offer ↗
+1.5 FP/game vs. the pre-playoff outlook (17.0). Build an offer ↗
+1.5 FP/game vs. the pre-playoff outlook (18.0). Build an offer ↗
+1.4 FP/game vs. the pre-playoff outlook (15.7). Build an offer ↗
+1.3 FP/game vs. the pre-playoff outlook (16.2). Build an offer ↗
+1.2 FP/game vs. the pre-playoff outlook (18.2). Build an offer ↗
+0.9 FP/game vs. the pre-playoff outlook (17.6). Build an offer ↗
+0.8 FP/game vs. the pre-playoff outlook (16.7). Build an offer ↗
+0.6 FP/game vs. the pre-playoff outlook (13.7). Build an offer ↗
+0.6 FP/game vs. the pre-playoff outlook (16.0). Build an offer ↗
+0.5 FP/game vs. the pre-playoff outlook (7.0). Build an offer ↗
+0.5 FP/game vs. the pre-playoff outlook (16.2). Build an offer ↗
+0.5 FP/game vs. the pre-playoff outlook (18.2). Build an offer ↗
+0.5 FP/game vs. the pre-playoff outlook (8.4). Build an offer ↗
+0.4 FP/game vs. the pre-playoff outlook (18.6). Build an offer ↗
+0.4 FP/game vs. the pre-playoff outlook (14.6). Build an offer ↗
+0.4 FP/game vs. the pre-playoff outlook (17.9). Build an offer ↗
+0.4 FP/game vs. the pre-playoff outlook (10.1). Build an offer ↗
+0.4 FP/game vs. the pre-playoff outlook (9.2). Build an offer ↗
+0.4 FP/game vs. the pre-playoff outlook (6.6). Build an offer ↗
+0.3 FP/game vs. the pre-playoff outlook (7.3). Build an offer ↗
+0.2 FP/game vs. the pre-playoff outlook (20.8). Build an offer ↗
+0.2 FP/game vs. the pre-playoff outlook (16.6). Build an offer ↗
The board uses the shared FF weekly forecasts and ranks up to 24 results from the current projection pool. Bye weeks are excluded from per-game averages and flagged for cover. Incomplete windows are withheld from the averages and trade rankings. Trade targets are ranked by their change in projected points per game and need a valid pre-playoff baseline. The handcuff view checks up to 16 teams with lower-rostered running backs and lists only ESPN-verified backups. Forecasts and roles can change.